What Are U.S. Carbon Emissions by Year?
Updated Jan. 5 2021, 10:07 a.m. ET

According to the U.S. Energy Information Administration (EIA), the U.S. emitted somewhere around 5.1 billion metric tons of energy-related carbon dioxide in 2017 alone. That year, the total global emissions reached a total of 32.5 billion tons, and though we’re sorry to say it, those numbers have not gotten much better since then.
Much of the blame for the increased amount of carbon emissions can be blamed on political policy. It’s no secret that President Donald Trump’s administration has favored economic stability over environmental protection from the very start. The result of which is that air pollution coming from the U.S. has risen steadily over the last four years.

What are carbon emissions?
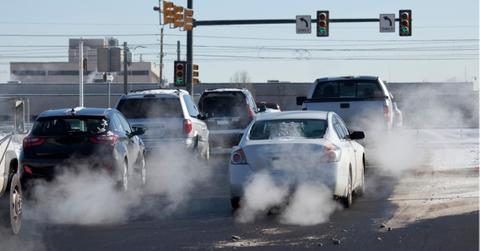
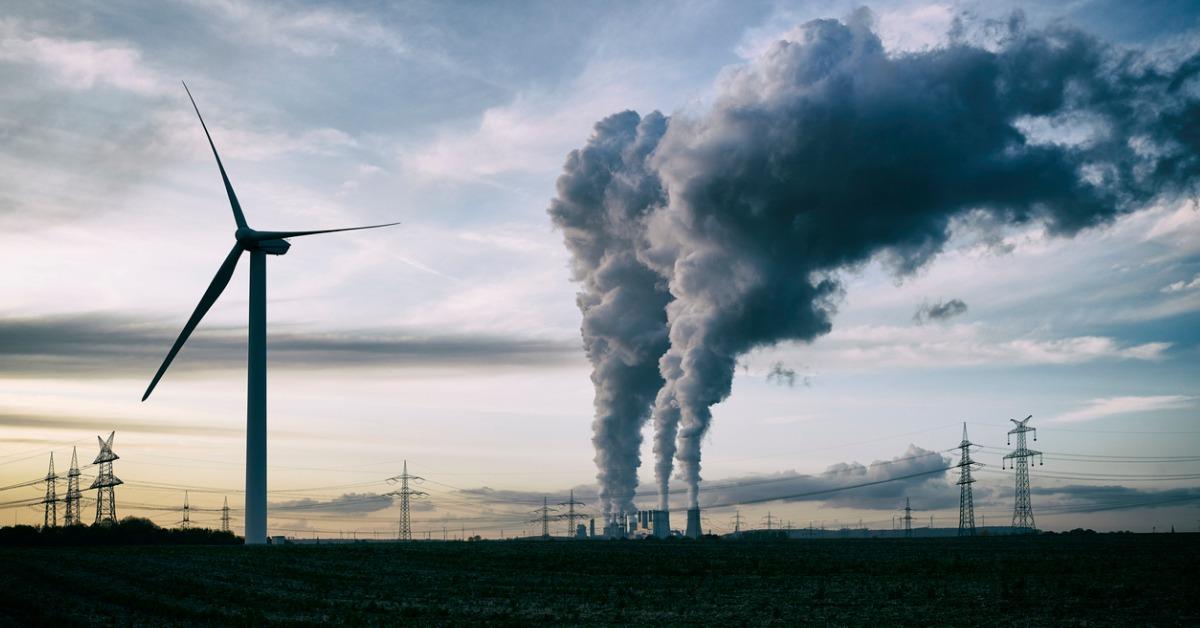
Carbon emissions are most often caused when carbon dioxide, methane, nitrous oxide, ozone, and water vapor are released by the burning of fossil fuels. These emissions, usually seen as smoke or smog coming from factories or automobiles, escape up into the atmosphere. Once there, these greenhouse gases trap the sun’s heat beneath the ozone layer, thereby warming the average global temperature. The result is a global warming effect which then contributes to climate change.
Fossil fuels like coal and gasoline are the main causes of these carbon emissions, though there are others. Nevertheless, for a country like the U.S., whose economy and energy are so reliant on coal and oil, it’s easy to see how the average number of emissions is somewhere in the many billions.

When did the U.S. start keeping track of carbon emissions?
The smog-spewing fires of industry began to show their cards pretty early on, but it wasn’t until the late 1980s or early 1990s that people started to take notice. An annual report was released by the EIA that gave a comprehensive accounting of total greenhouse gas emissions for all man-made sources in the U.S. at that time, and that report was pretty telling.
It was not only carbon emissions that this report was investigating either. Other gases in the report included methane, nitrous oxide, hydrofluorocarbons, perfluorocarbons, sulfur hexafluoride, and nitrogen trifluoride, all of which were actively contributing to global warming. The EPA still receives this report today, and the emissions they have recorded in recent years are disconcerting, to say the least.

What was the total number of U.S. greenhouse gas emissions in 2018?
In 2018, U.S. greenhouse gas emissions totaled 6,677 million metric tons of carbon dioxide equivalents. These numbers were up by 3.1 percent from the previous year, which made sense, as by then, the U.S. had already begun pulling out of the Paris Agreement. Of course, multiple factors contributed to this increase. Increased use of electricity and oil due to heating and cooling needs for that year, was the result of both a colder winter and a hotter summer than the year previous.
What was the total number of greenhouse gas emissions in 2019?
In 2019, it is estimated that 43 billion tons of carbon dioxide emissions were sent into the atmosphere from all world sources. As with years previous, scientists assume that much of this carbon dioxide will be absorbed by the oceans or consumed by plants, but there is no doubt that last year’s rising numbers did a serious blow to the ever-worsening situation that is global climate change.

What do the number of carbon emissions look like in 2020?
While the coronavirus pandemic has helped slightly in lowering the global average of carbon emissions and clearing up pollution all over the world, it is by no means a catch-all solution. Firstly, scientists are still lacking any definitive proof that locking down the globe did anything other than put a Band-Aid on a much more serious wound. And secondly, so long as wealth and industry continue to Trump the overall health of the planet, carbon emissions will continue to negatively impact climate change.